


- text size
- Enlarge Text Size
- Shrinking font size
Air quality control
basement station indoor air quality measurement
- based reason : law No.12 of indoor air quality management(indoor air quality measurement)
- maintenance standard and the measured results(how often to measure: annually)
You can check out the more details by scrolling right and left.
maintenance standard and the measured results (based on year 2024) division fine dust
(㎍/㎥)ultrafine dust
(㎍/㎥)carbon dioxide
(ppm)form aldehyde
(㎍/㎥)carbon monoxide(ppm) standard less than 100㎍/㎥ less than 50㎍/㎥ less than 1,000ppm less than 100㎍/㎥ less than 10ppm average 29.7 19.6 520 8.7 0.4 line1 27.7 20.3 522 7.1 0.3 line2 28.3 17.1 480 4.6 0.6 line3 27.9 16.3 540 8.9 0.4 line4 35.2 24.9 540 14.3 0.4 - recommended standard & measured result(how often to measure: once every two years)
You can check out the more details by scrolling right and left.
recommended standard & measured result (based on year 2023) division nitrogen dioxide (ppm) radon (Bq/m3) volatile organic compounds (㎍/㎥) standard less than 0.1 less than 148 less than 500 average 0.017 12.0 128.2 line 1 0.018 12.7 98.3 line 2 0.020 9.1 183.5 line 3 0.015 13.6 149.4 line 4 0.018 12.8 81.9
Air quality measurement in the motor car
- based reason : Law No.9 article 2 of indoor air quality management(Measurement on Indoor Air Quality in Public Transportation Vehicles)
- measured result
You can check out the more details by scrolling right and left.
measured result (based on year 2024) division ultrafine dust
(PM2.5)carbon dioxide
(CO2)standard less than 50㎍/㎥ less than 2,000ppm(uncrowded) less than 2,500ppm(crowded) average 7.3 1,421 1,518 line1 10.2 1,364 1,556 line2 5.0 1,314 1,341 line3 7.8 1,592 1,654 line4 6.1 1,413 1,523
efforts to improve air quality
ventilation facility operation for the clean environment
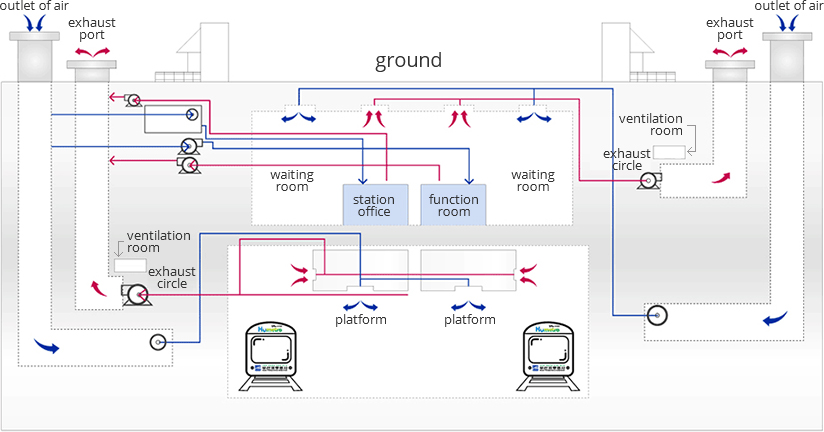
air screening device periodic filter cleaning
- As air filter device is installed in the air inlet and the air conditioner, outdoor air can go through the filter and fresh air come in the station
- period : auto cleaning(once a day), manual cleaning(once a month), high pressure cleaning (annually)
water washing in the ground tunnel
- periodic cleaning is a must for clean and fresh environment
enhancement and exchange of old ventilation facility
- ventilation fan exchange, station ventilation duct enhancement, air filtering device exchange

(47353) 20, Jungang-daero 644beon-gil, Busanjin-gu, Busan, Republic of Korea Tel : 1544-5005
Copyright (C) 2015 Busan Transportation Corporation. All Rights Reserved.
 TOP
TOP